|
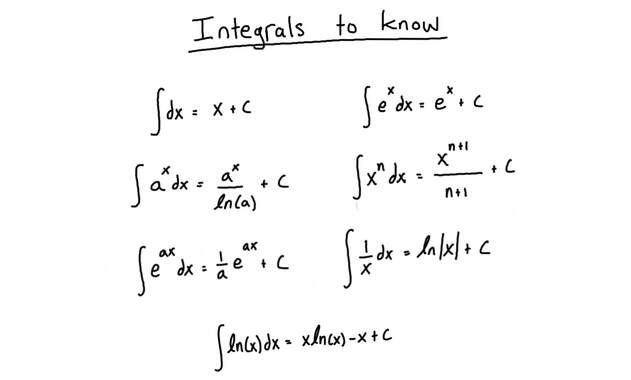
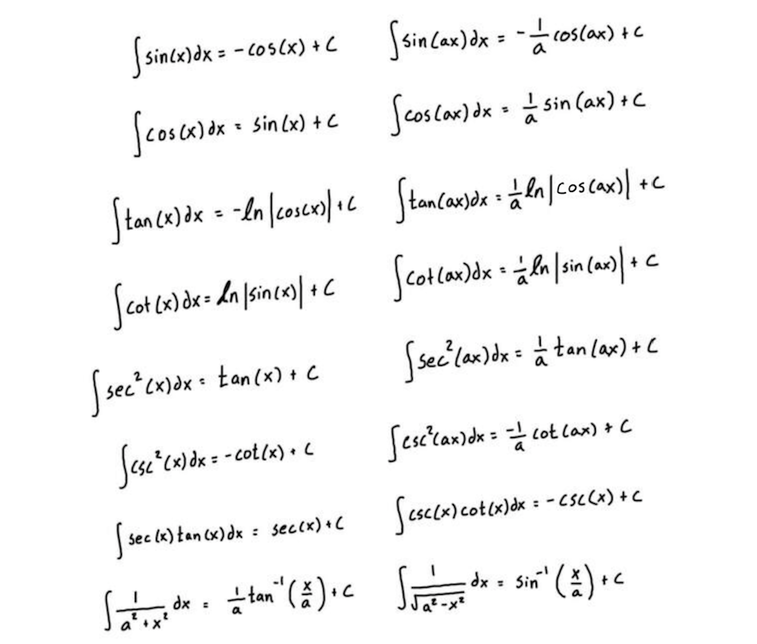
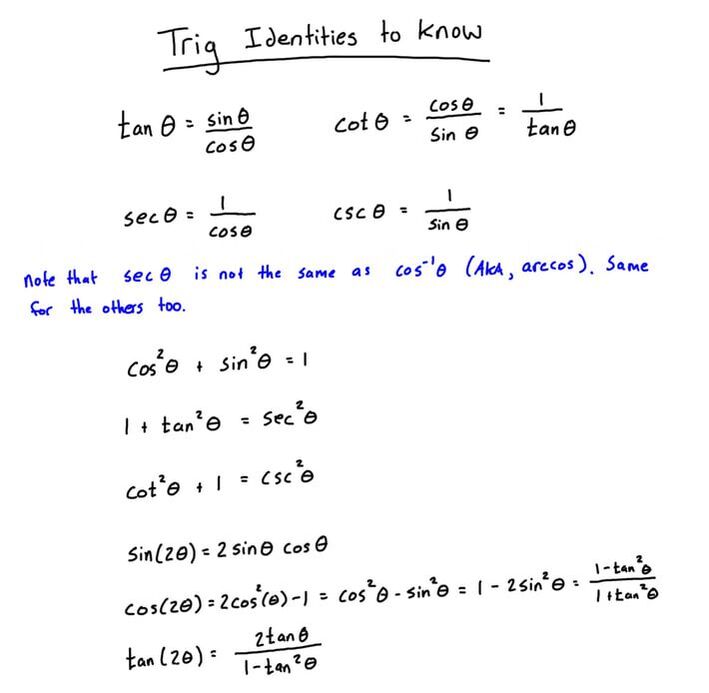
Here is an integral table with several integrals that are just good to know. It's not comprehensive, there are so many more that could be included, but it's a decent collection. This is actually typical of what you might be provided on a Calculus 2 exam as a formula sheet. Often when you are solving integrals, any time you get one into one of the forms below, you can immediately write the associated solution, rather than computing the last steps. This is referred to as "the table method" or "solving integrals by table." There are also some trigonometric identities included, that also can be swapped anytime you see an available substitution. Usually you would use a trig identity to get an integral into one of the forms that's present in the table, to then immediately jump to a solution. You can download the PDF version here.
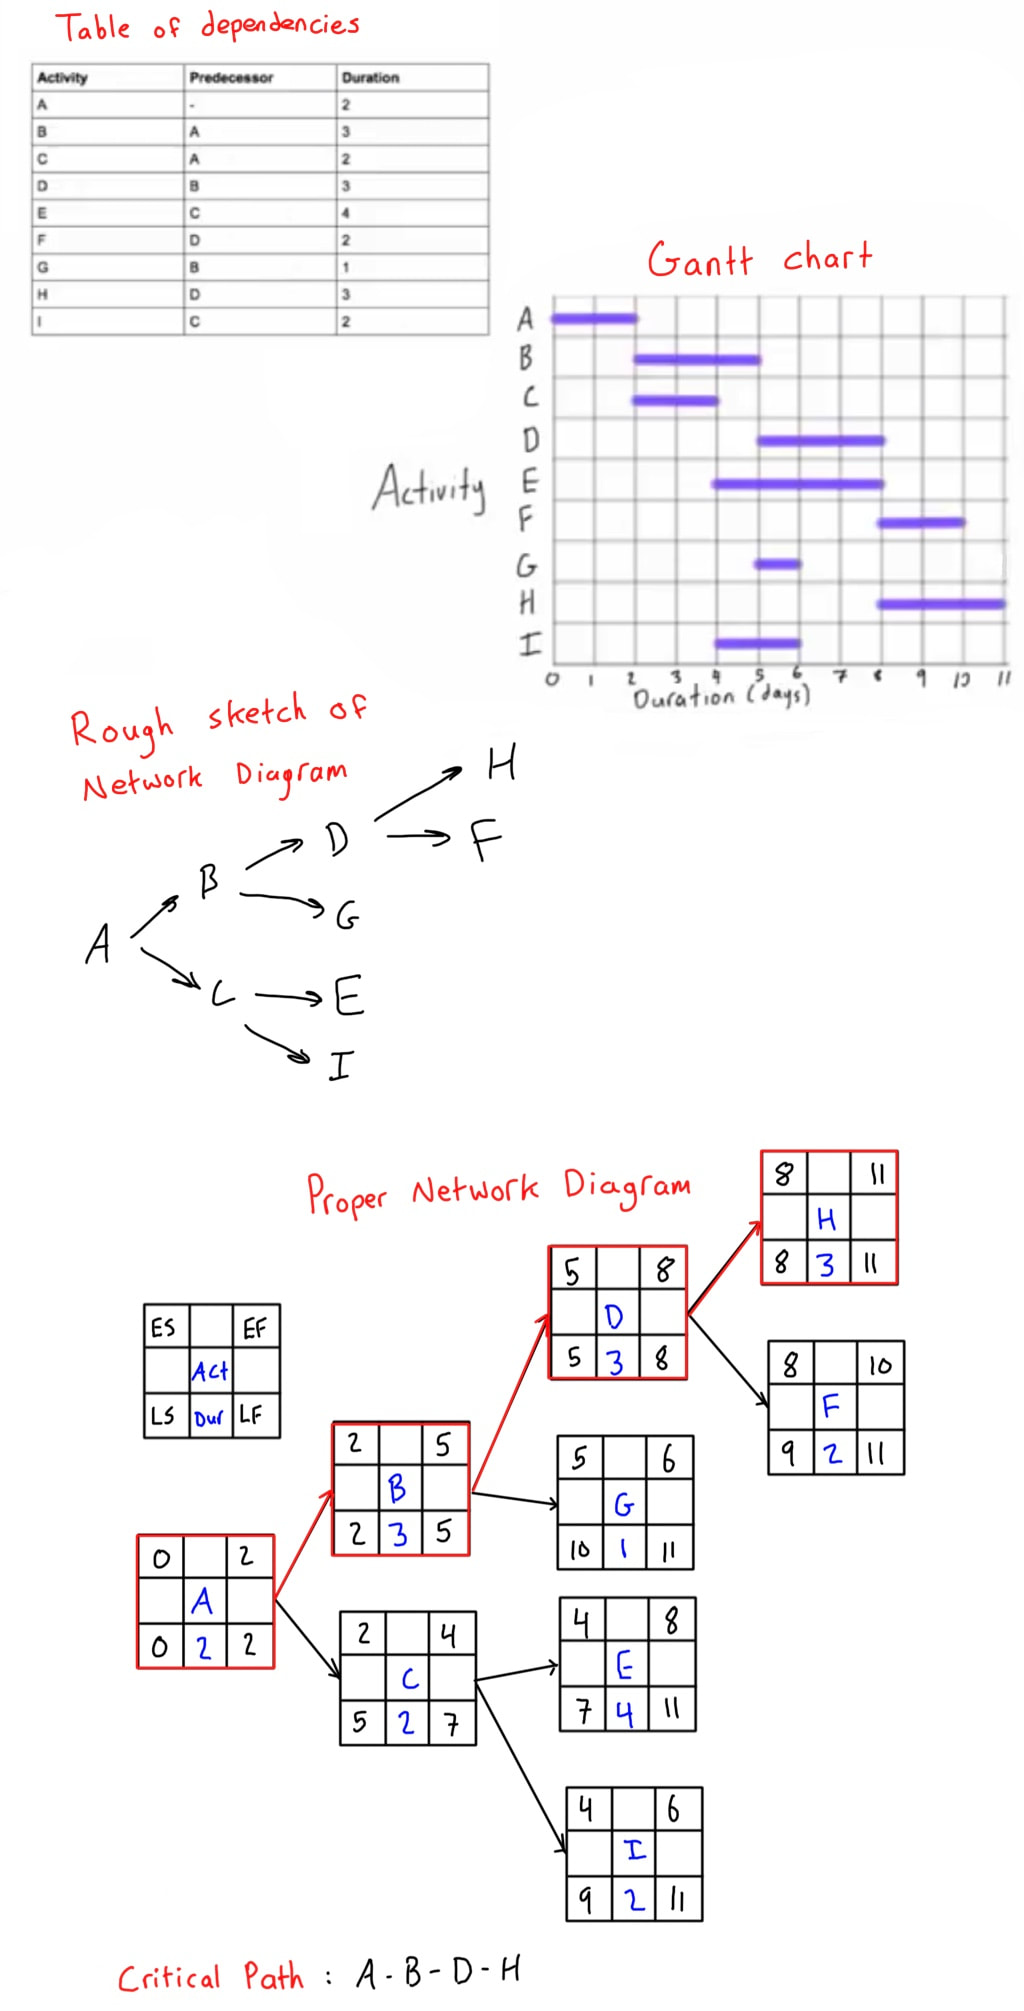
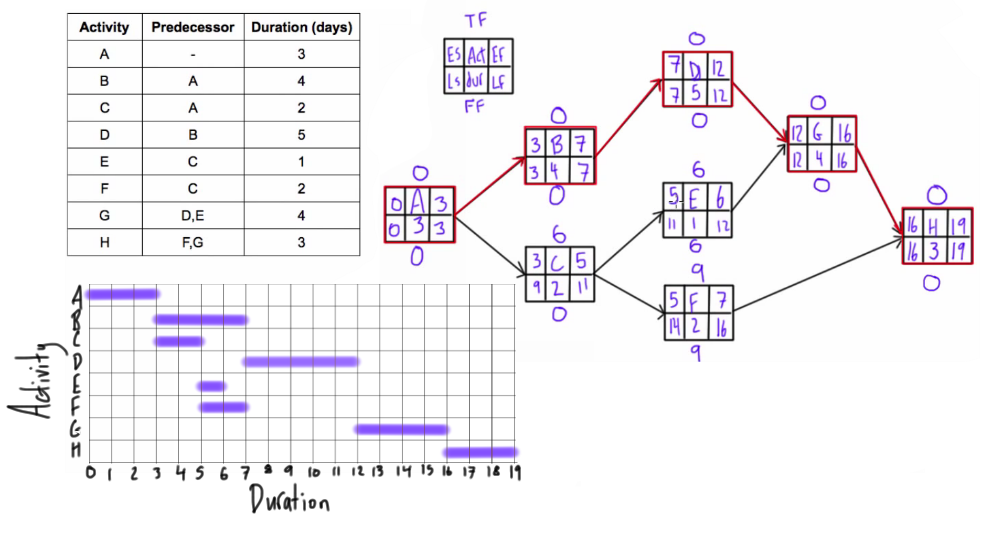
Below is the table of dependencies and Gantt from this Project Management Tutorial. The original tutorial did not include drawing the network diagram, so I have included it below for clarification. It is an AON (Activity on Arrow - also sometimes called Activity on Node) network diagram. When drawing a network diagram, it’s best to first draw a rough sketch based on the activity relationships. You might not get it right on the first attempt, but that’s fine, just erase and redraw until you have no (or the least amount possible) crossovers. Once your rough sketch is good, format it to be nicer like you see below. Start with either 0 or 1 (depends which numbering system you’re been taught to use), and then complete the forward pass. Notice that there are five terminal activities in this project. Find the one with the greatest EF (it’s 11), and then put that value as the LF for all terminal activities, then proceed with the backward pass. Quick note: If you draw your network diagram starting with a zero like I do, then you should also draw your Gantt chart starting with a zero. They should match! The beginning and end of each activity on the Gantt chart should also correspond to the ES (early start) and EF (early finish) of each activity. The critical path is made up of path of activities who’s ES and LS are the same (or EF and LF). Highlight it either on the diagram like I did in red, or write it below. The critical path of this project is A - B - D H. You can find the whole project management course here.
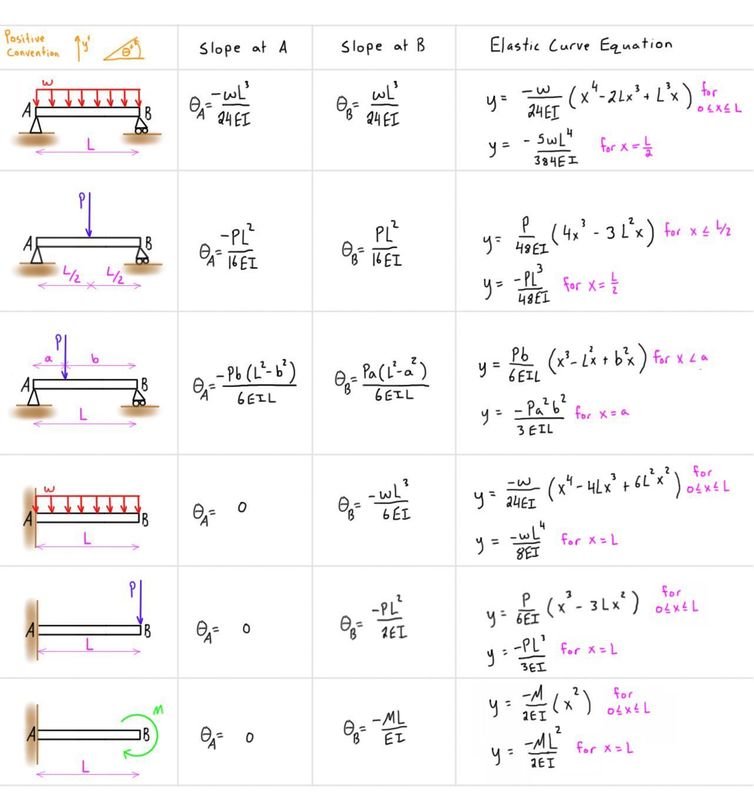
Here's a table with the slopes and deflections of some common statically determinate beams. Using these kinds of tables can greatly speed up many mechanics of materials and structural analysis problems. The positive sign convention for the outputs is defined in orange, and the equations assume that the external loading is applied in the direction specified on the drawing. If your loading is opposite (for example, a counter-clockwise applied moment at point B on the cantilever beam) then make sure you input it as a negative value. Please take a second to actually think about the answers you get from using these shortcuts. If the formula is telling you that your displacement is upwards, but you think it should be downwards, then check your work for errors until you are satisfied.
Several of the project management tutorials all use the same table of dependencies. The Gantt chart never shows up in the tutorials because they are all focused on specific aspects of drawing and working with the network diagram. I have drawn the Gantt chart below for anyone that is curious about what it looks like.
|
|
© Copyright www.engineer4free.com 2012 - 2024 All Rights Reserved
About | Course List | Patreon | Newsletter | Blog | ToS | Contact Engineer4Free is committed to sustainability. You should be too. |
|

